# load packages
library(tidyverse)       # for data wrangling
library(tidymodels)      # for modeling
library(fivethirtyeight) # for the fandango dataset

# set default theme and larger font size for ggplot2
ggplot2::theme_set(ggplot2::theme_minimal(base_size = 16))

# set default figure parameters for knitr
knitr::opts_chunk$set(
  fig.width = 8,
  fig.asp = 0.618,
  fig.retina = 3,
  dpi = 300,
  out.width = "80%"
)SLR: Fitting models in R with tidymodels
Prof. Maria Tackett
Sep 05, 2022
Announcements
No office hours today. Office hours start Tuesday, September 6. Click here for full schedule
Check your email for an email to join the course GitHub organization. You will receive one by Tuesday, September 6.
See Week 02 for this week’s activities.
Topics
- Introduce the computing toolkit - RStudio and GitHub
- Use tidymodels to fit and summarize regression models in R
- Complete an application exercise on exploratory data analysis and modeling
Computational setup
Computing toolkit
Reproducibility checklist
What does it mean for an analysis to be reproducible?
Near term goals:
✔️ Are the tables and figures reproducible from the code and data?
✔️ Does the code actually do what you think it does?
✔️ In addition to what was done, is it clear why it was done?
Long term goals:
✔️ Can the code be used for other data?
✔️ Can you extend the code to do other things?
Toolkit
Scriptability \(\rightarrow\) R
Literate programming (code, narrative, output in one place) \(\rightarrow\) Quarto
Version control \(\rightarrow\) Git / GitHub
- More on this in this week’s lab
What are R and RStudio?
R is a statistical programming language
RStudio is a convenient interface for R (an integrated development environment, IDE)
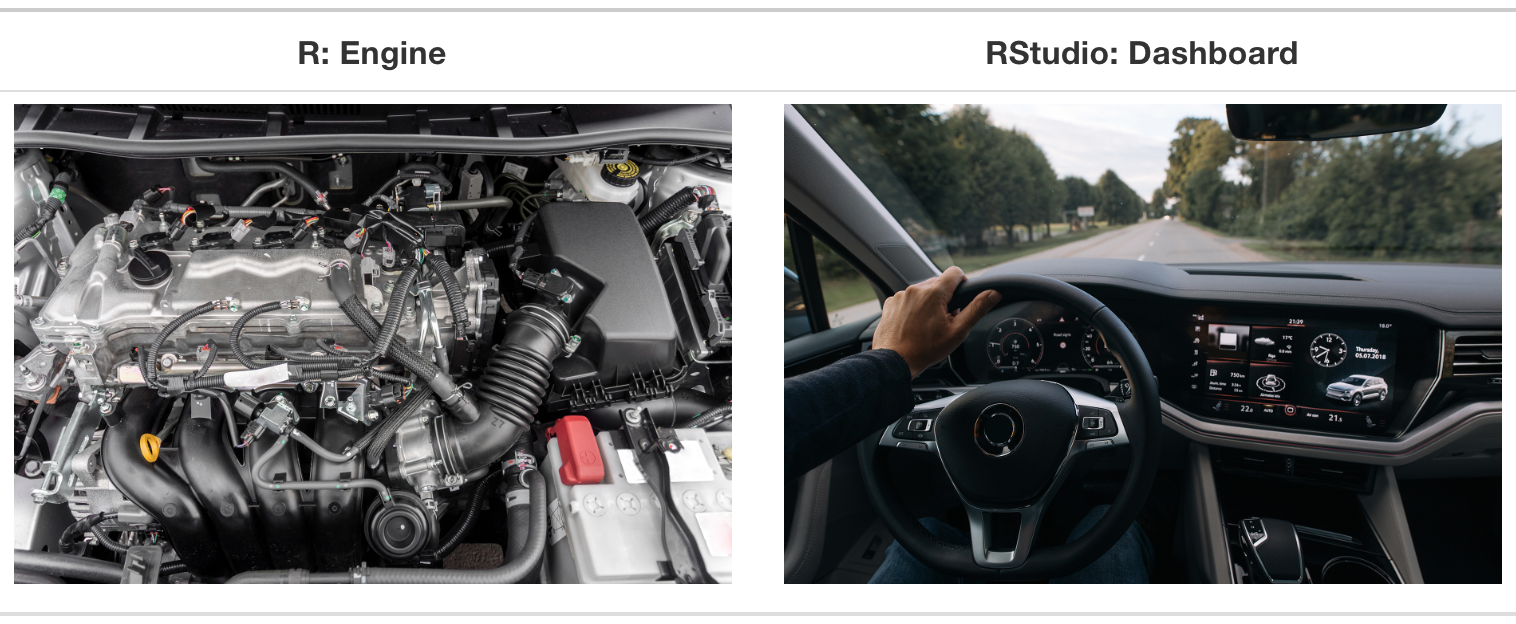
Source: Modern Dive
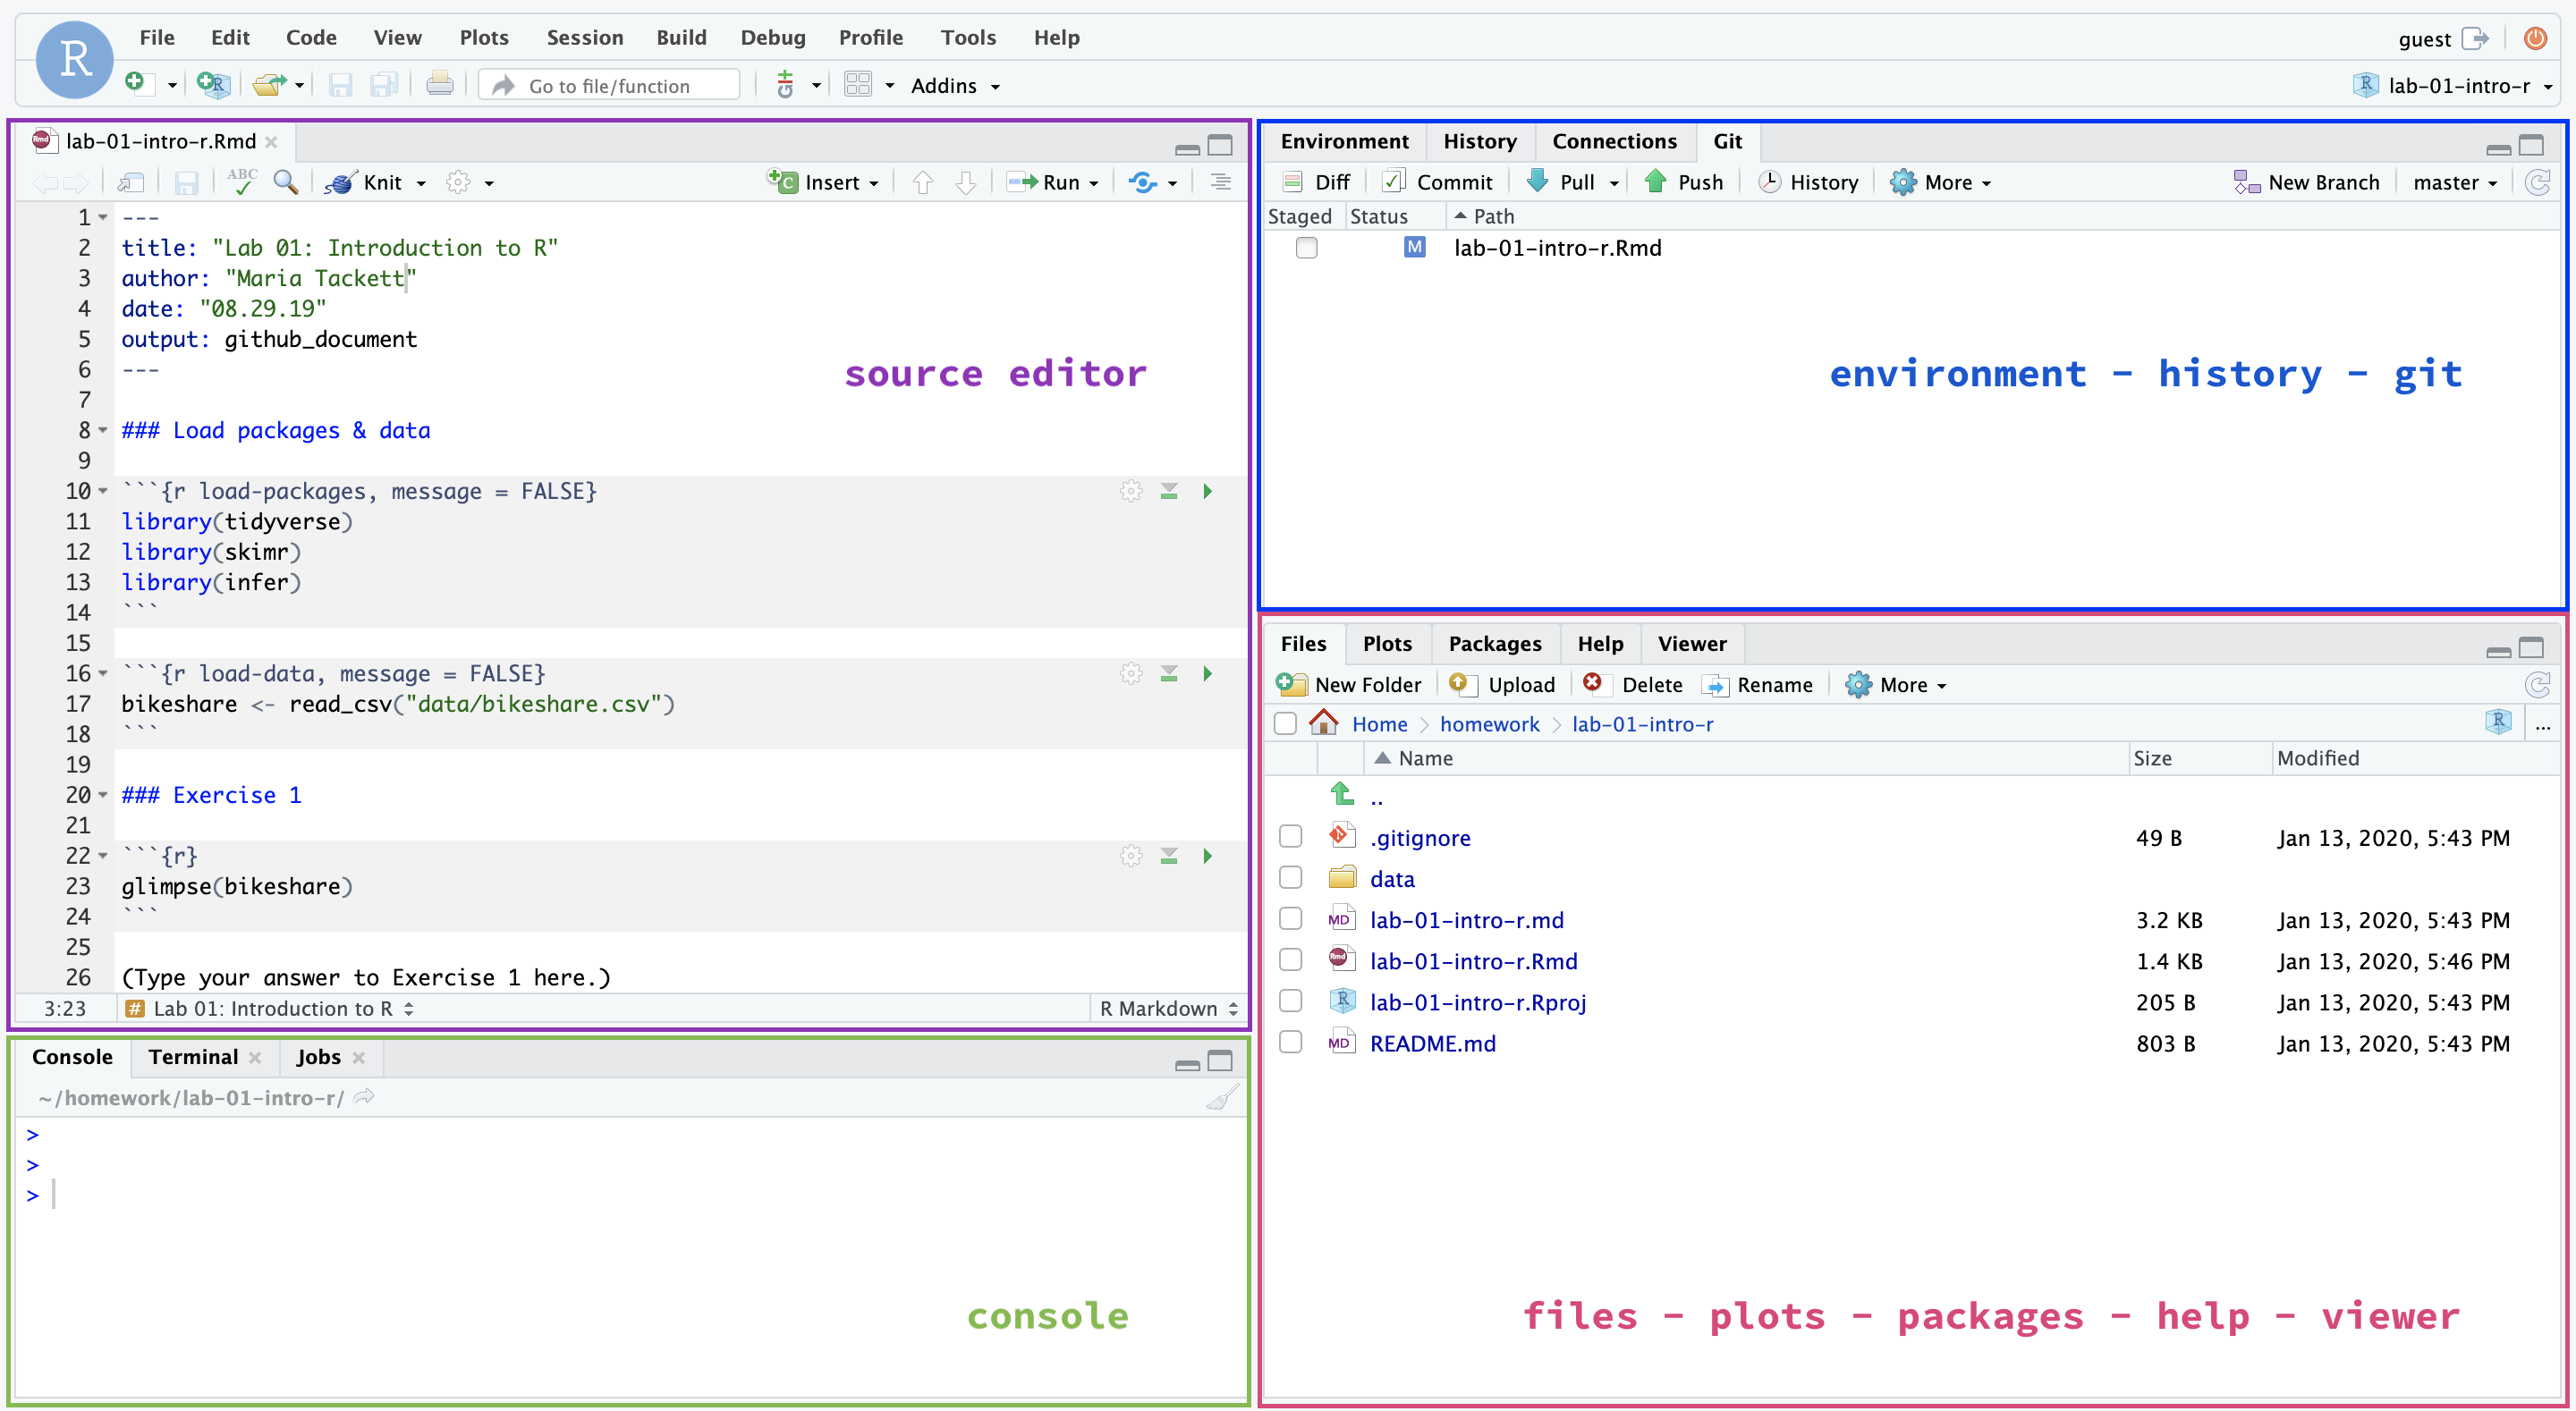
RStudio IDE
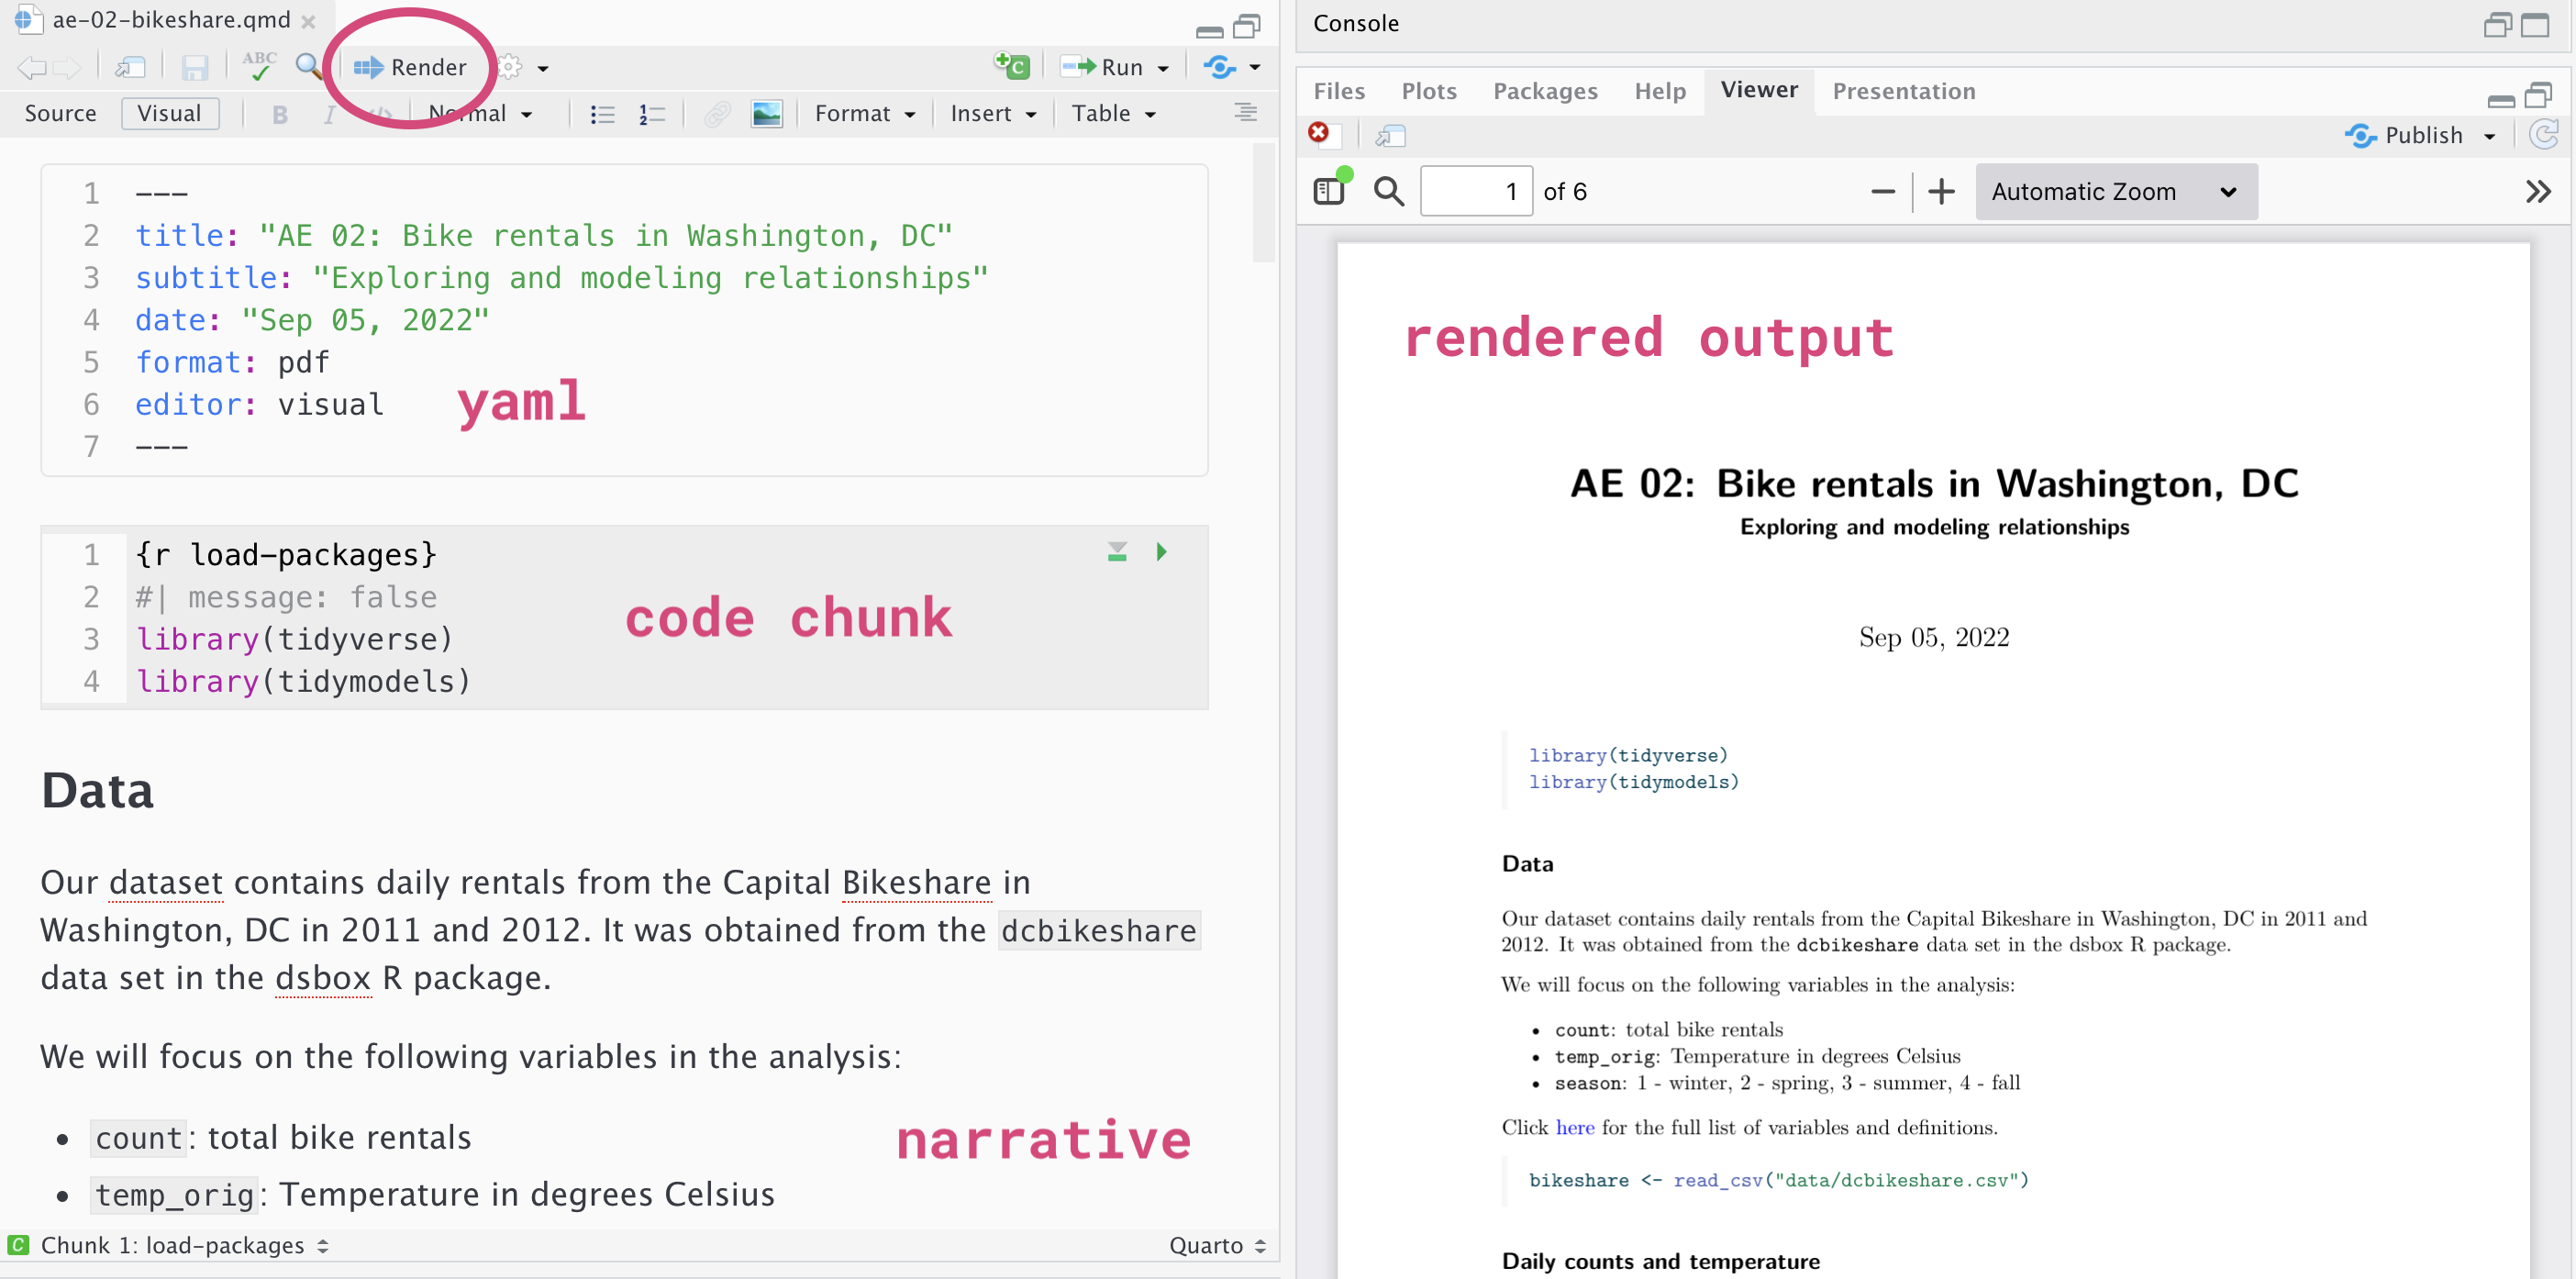
Quarto
Fully reproducible reports – the analysis is run from the beginning each time you render
Code goes in chunks and narrative goes outside of chunks
Visual editor to make document editing experience similar to a word processor (Google docs, Word, Pages, etc.)
Quarto
How will we use Quarto?
Every application exercise and assignment is written in a Quarto document
You’ll have a template Quarto document to start with
The amount of scaffolding in the template will decrease over the semester
Application exercise
Using R for SLR
Recap of last lecture
Used simple linear regression to describe the relationship between a quantitative predictor and quantitative outcome variable.
Used the least squares method to estimate the slope and intercept.
We interpreted the slope and intercept.
- Slope: For every one unit increase in \(x\), we expect y to be higher/lower by \(\hat{\beta}_1\) units, on average.
- Intercept: If \(x\) is 0, then we expect \(y\) to be \(\hat{\beta}_0\) units.
Predicted the response given a value of the predictor variable.
Defined extrapolation and why we should avoid it.
Data
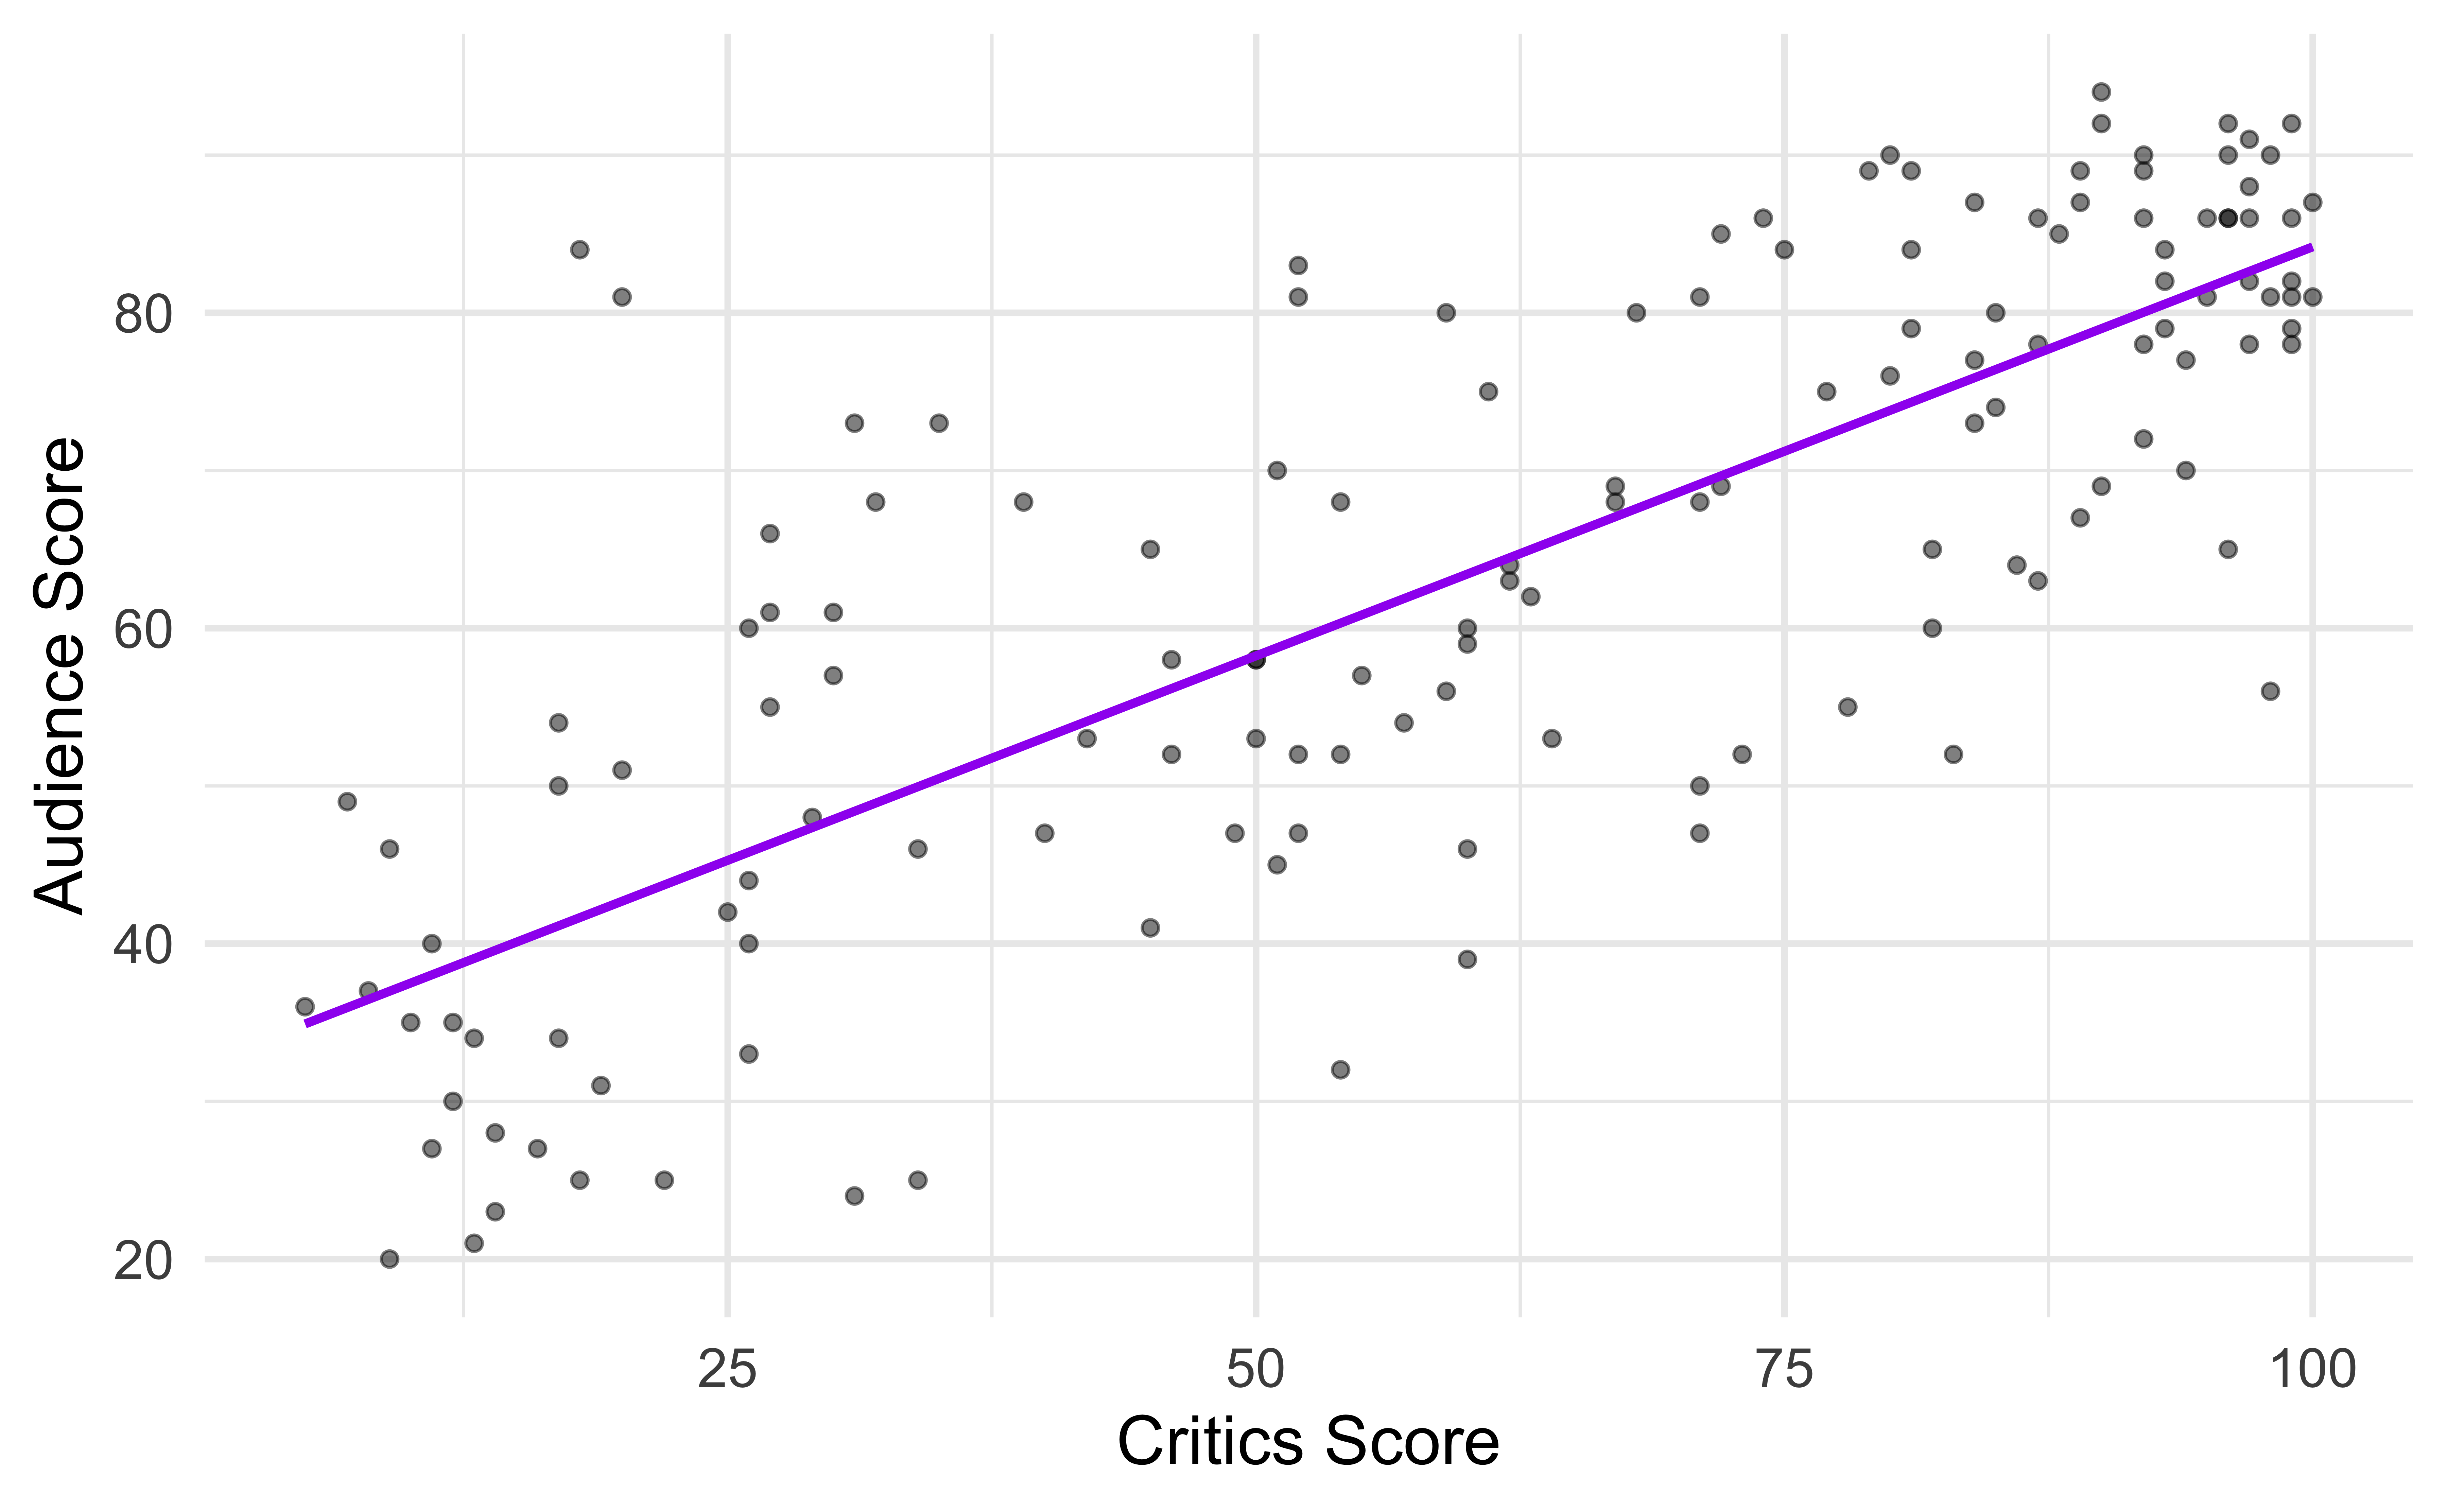
Movie ratings
- Data behind the FiveThirtyEight story Be Suspicious Of Online Movie Ratings, Especially Fandango’s
- In the fivethirtyeight package:
fandango - Contains every film that has at least 30 fan reviews on Fandango, an IMDb score, Rotten Tomatoes critic and user ratings, and Metacritic critic and user scores


Data prep
- Rename Rotten Tomatoes columns as
criticsandaudience - Rename the dataset as
movie_scores
\[ \widehat{\text{audience}} = 32.3142 + 0.5187 \times \text{critics} \]
tidymodels
The tidymodels framework is a collection of packages for modeling and machine learning using tidyverse principles.
── Attaching packages ────────────────────────────────────── tidymodels 1.0.0 ──✔ broom 1.0.0 ✔ rsample 1.0.0
✔ dials 1.0.0 ✔ tune 1.0.0
✔ infer 1.0.2 ✔ workflows 1.0.0
✔ modeldata 1.0.0 ✔ workflowsets 1.0.0
✔ parsnip 1.0.0 ✔ yardstick 1.0.0
✔ recipes 1.0.1 ── Conflicts ───────────────────────────────────────── tidymodels_conflicts() ──
✖ scales::discard() masks purrr::discard()
✖ dplyr::filter() masks stats::filter()
✖ recipes::fixed() masks stringr::fixed()
✖ dplyr::lag() masks stats::lag()
✖ yardstick::spec() masks readr::spec()
✖ recipes::step() masks stats::step()
• Search for functions across packages at https://www.tidymodels.org/find/Why tidymodels?
- Consistent syntax for different model types (linear, logistic, random forest, Bayesian, etc.)
- Streamline modeling workflow
- Split data into train and test sets
- Transform and create new variables
- Assess model performance
- Use model for prediction and inference
Fitting the model
Step 1: Specify model
Step 2: Set model fitting engine
Step 3: Fit model & estimate parameters
using formula syntax
A closer look at model output
movie_fit <- linear_reg() |>
  set_engine("lm") |>
  fit(audience ~ critics, data = movie_scores)

movie_fit
parsnip model object
Call:
stats::lm(formula = audience ~ critics, data = data)
Coefficients:
(Intercept) critics
32.3155 0.5187 \[\widehat{\text{audience}} = 32.3155 + 0.5187 \times \text{critics}\]
Note: The intercept is off by a tiny bit from the hand-calculated intercept, this is likely just due to rounding in the hand calculation.
The regression output
We’ll focus on the first column for now…
Prediction
Application exercise
Recap
- Introduced the computing toolkit - RStudio and GitHub
- Used tidymodels to fit and summarize regression models in R
- Completed an application exercise on exploratory data analysis and modeling