library(tidyverse)
library(tidymodels)
library(knitr)
library(GGally)AE 05: Multiple linear regression
Houses in Levittown
Important
Go to the course GitHub organization and locate your ae-05- to get started.
The AE is due on GitHub by Saturday, September 24 at 11:59pm.
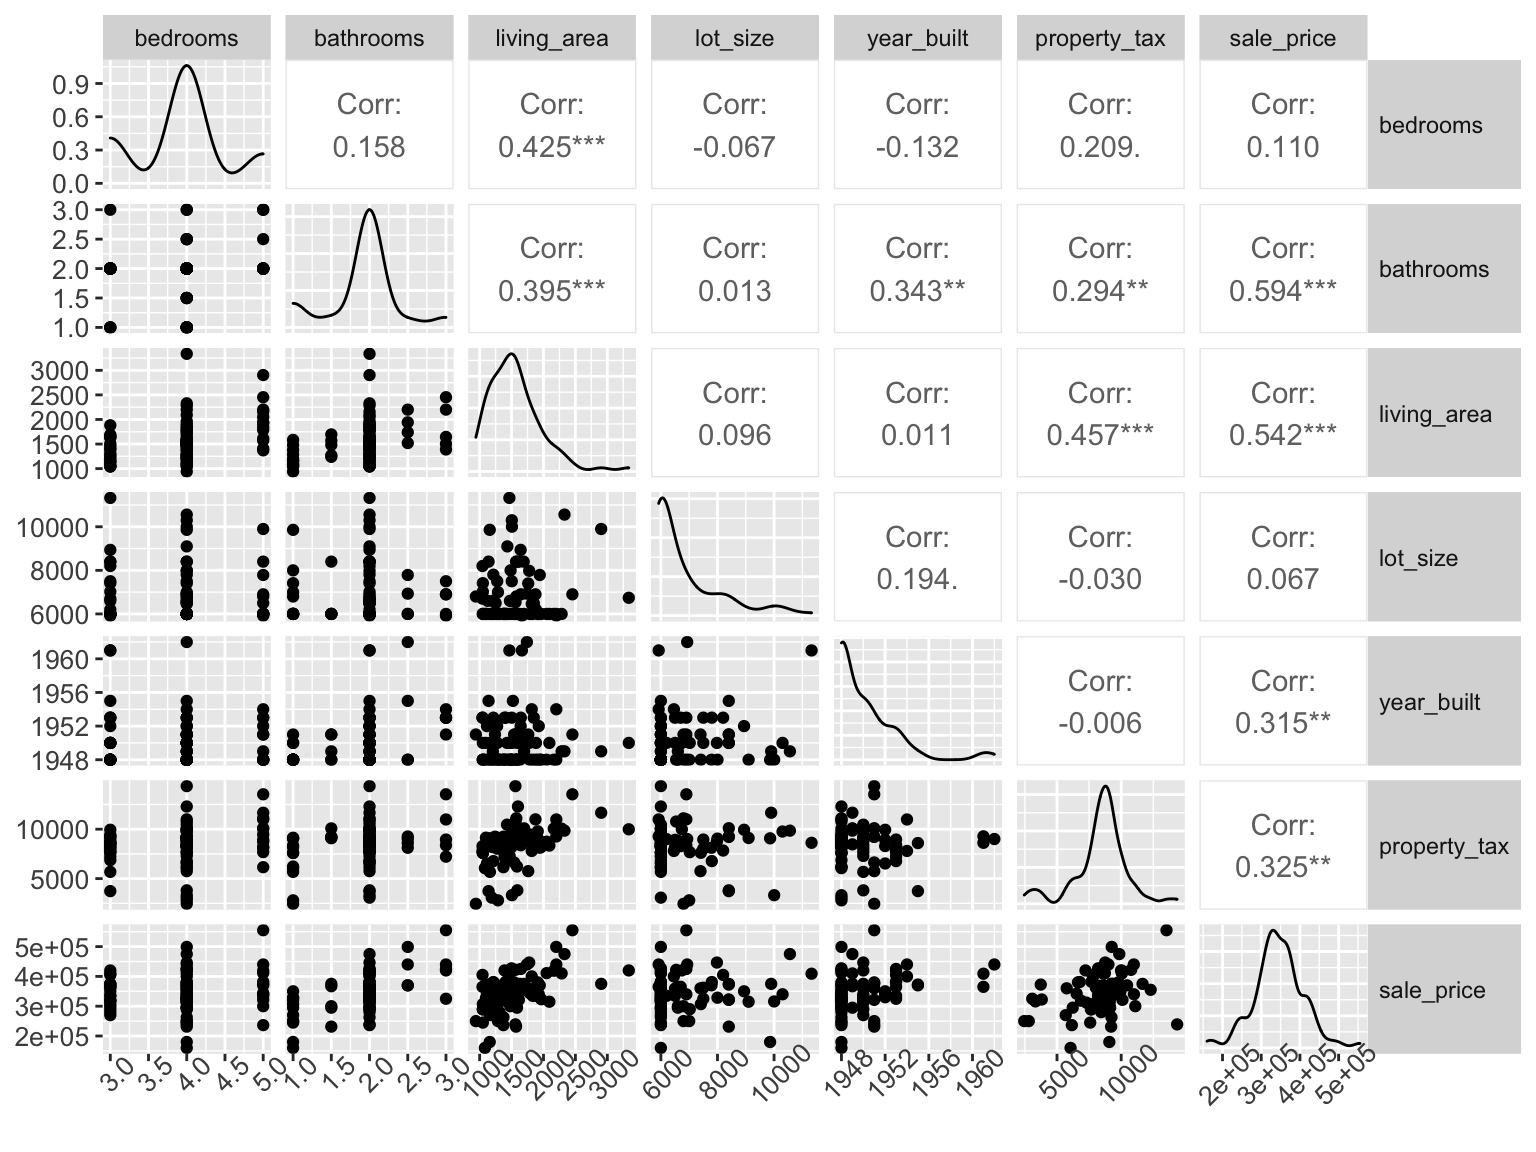
The data set contains the sales price and characteristics of 85 homes in Levittown, NY that sold between June 2010 and May 2011. Levittown was built right after WWII and was the first planned suburban community built using mass production techniques.
levittown <- read_csv("data/homeprices.csv")The variables used in this analysis are
bedrooms: Number of bedroomsbathrooms: Number of bathroomsliving_area: Total living area of the house (in square feet)lot_size: Total area of the lot (in square feet)year_built: Year the house was builtproperty_tax: Annual property taxes (in USD)sale_price: Sales price (in USD)
The goal of the analysis is to use the characteristics of a house to understand variability in the sales price.
Exploratory data analysis
ggpairs(levittown) +
  theme(
    axis.text.y = element_text(size = 10),
    axis.text.x = element_text(angle = 45, size = 10),
    strip.text.y = element_text(angle = 0, hjust = 0)
    )
Linear model
Fit a linear model of housing prices versus the house characteristics in Levittown. Neatly display model using 3 digits.
# fit model

# display model with 3 digits
Interpretation
Interpret the coefficient of
bedroomsin the context of the data.The intercept is the estimated sales price for what subset of houses? Be specific.
Prediction
What is the predicted sale price for a house in Levittown, NY with 4 bedrooms, 2 bathrooms, 1,000 square feet of living area, 6,000 square foot lot size, built in 1947 with $7,403 in property taxes?
- Report the predicted value and appropriate interval.
# create tibble for new observation

# prediction + interval- Interpret the interval in the context of the data.
Important
To submit the AE:
- Render the document to produce the PDF with all of your work from today’s class.
- Push all your work to your
ae-05-repo on GitHub. (You do not submit AEs on Gradescope).