library(tidyverse)
library(tidymodels)
library(openintro)
library(knitr)AE 04: Simulation-based hypothesis testing
Houses in Duke Forest
Important
Go to the course GitHub organization and locate your ae-04-bootstrap- to get started.
The AE is due on GitHub by Saturday, September 17 at 11:59pm.
Data
The data are on houses that were sold in the Duke Forest neighborhood of Durham, NC around November 2020. It was originally scraped from Zillow, and can be found in the duke_forest data set in the openintro R package.
glimpse(duke_forest)Rows: 98
Columns: 13
$ address <chr> "1 Learned Pl, Durham, NC 27705", "1616 Pinecrest Rd, Durha…
$ price <dbl> 1520000, 1030000, 420000, 680000, 428500, 456000, 1270000, …
$ bed <dbl> 3, 5, 2, 4, 4, 3, 5, 4, 4, 3, 4, 4, 3, 5, 4, 5, 3, 4, 4, 3,…
$ bath <dbl> 4.0, 4.0, 3.0, 3.0, 3.0, 3.0, 5.0, 3.0, 5.0, 2.0, 3.0, 3.0,…
$ area <dbl> 6040, 4475, 1745, 2091, 1772, 1950, 3909, 2841, 3924, 2173,…
$ type <chr> "Single Family", "Single Family", "Single Family", "Single …
$ year_built <dbl> 1972, 1969, 1959, 1961, 2020, 2014, 1968, 1973, 1972, 1964,…
$ heating <chr> "Other, Gas", "Forced air, Gas", "Forced air, Gas", "Heat p…
$ cooling <fct> central, central, central, central, central, central, centr…
$ parking <chr> "0 spaces", "Carport, Covered", "Garage - Attached, Covered…
$ lot <dbl> 0.97, 1.38, 0.51, 0.84, 0.16, 0.45, 0.94, 0.79, 0.53, 0.73,…
$ hoa <chr> NA, NA, NA, NA, NA, NA, NA, NA, NA, NA, NA, NA, NA, NA, NA,…
$ url <chr> "https://www.zillow.com/homedetails/1-Learned-Pl-Durham-NC-…Exploratory data analysis
ggplot(duke_forest, aes(x = area, y = price)) +
  geom_point(alpha = 0.7) +
  labs(
    x = "Area (square feet)",
    y = "Sale price (USD)",
    title = "Price and area of houses in Duke Forest"
  ) +
scale_y_continuous(labels = label_dollar()) 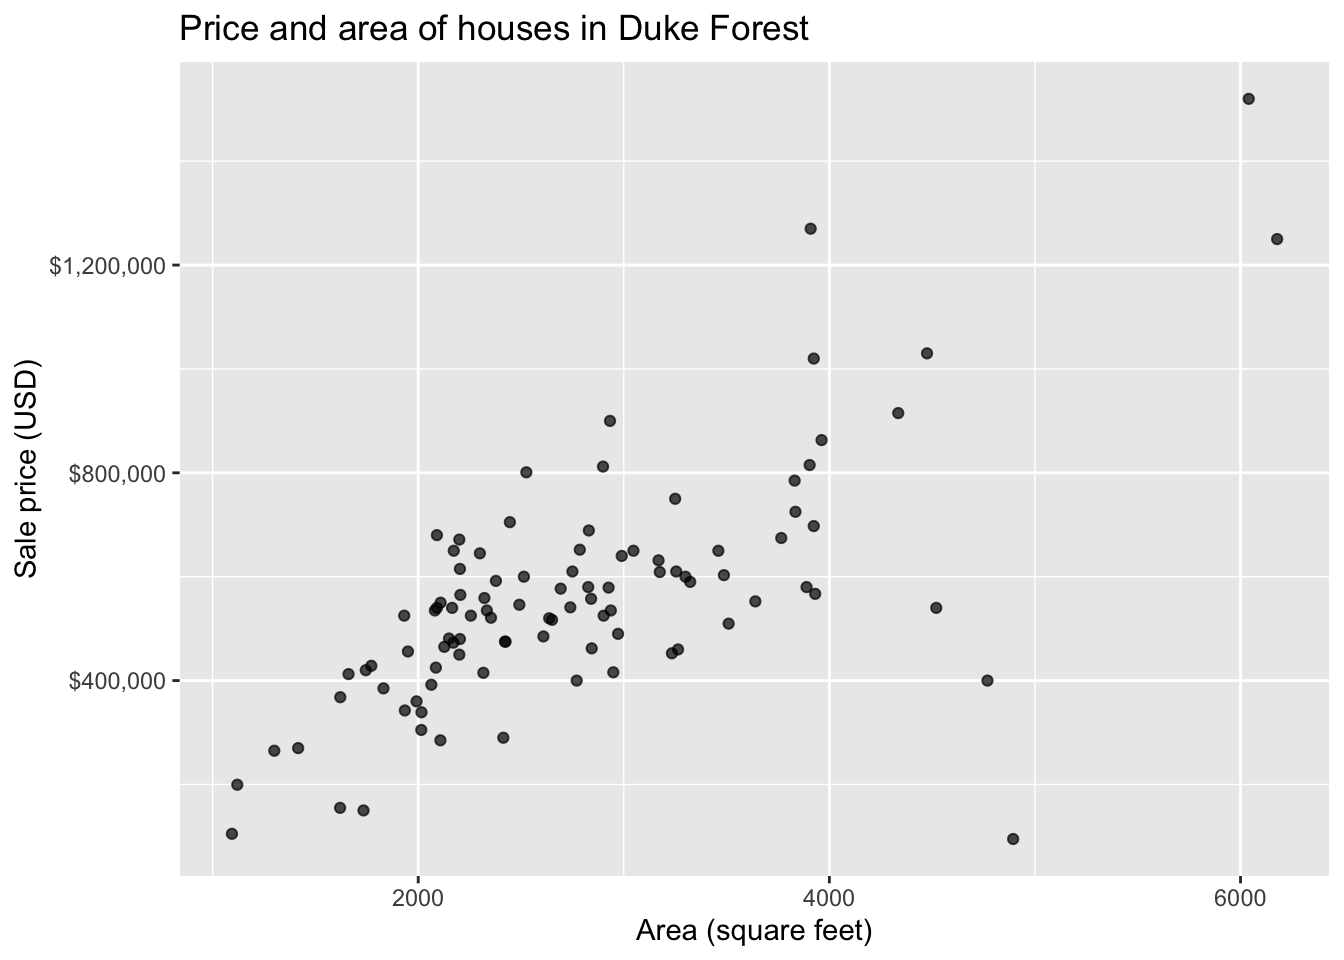
Model
df_fit <- linear_reg() |>
  set_engine("lm") |>
  fit(price ~ area, data = duke_forest)

tidy(df_fit) |>
kable(digits = 2)| term | estimate | std.error | statistic | p.value |
|---|---|---|---|---|
| (Intercept) | 116652.33 | 53302.46 | 2.19 | 0.03 |
| area | 159.48 | 18.17 | 8.78 | 0.00 |
Hypothesis test
Tip
For code chunks with fill-in-the-blank code, change code chunk option to #| eval: true once you’ve filled in the code.
State the null and alternative hypotheses
[Add hypotheses in mathematical notation]
Generate null distribution using permutation
Fill in the code, then set eval: true .
n = 100
set.seed(09142022)

null_dist <- _____ |>
  specify(______) |>
  hypothesize(null = "independence") |>
  generate(reps = _____, type = "permute") |>
  fit()
Visualize distribution
# Code for histogram of null distributionCalculate the p-value.
# get observed fit
observed_fit <- duke_forest |>
  specify(price ~ area) |>
  fit()

# calculate p-value
get_p_value(
  ____,
  obs_stat = ____,
  direction = "two-sided"
)- What does the warning message mean?
State conclusion
[Write your conclusion in the context of the data.]
Important
To submit the AE:
- Render the document to produce the PDF with all of your work from today’s class.
- Push all your work to your
ae-04-repo on GitHub. (You do not submit AEs on Gradescope).